Global Hamburger Economics
“All I know is that when I needed McDonald’s, McDonald’s was there for me.”
James Franco
It is my favorite time of year—fall and Halloween. It is also one of my least favorite times of the year—quarter end and letter writing. It isn’t that I don’t love communicating with clients through the letter, I do, and I owe them that and much more, especially when performance is struggling. But it is simply hard trying to come up with something unique to say when the main thing driving markets is interest rates, inflation, and thematic AI (artificial intelligence) investing.
I could almost sum up the current quarter in one abbreviated paragraph that goes something like this:
US interest rates were up this quarter again, acting as a magnet for assets around the world, as investors largely walked away from riskier assets like small capitalization stocks, especially those in international and emerging markets, in favor of owning high-yield risk-free assets like Certificates of Deposit in the US. We, overweight in small-capitalization international and emerging markets assets, were in the wrong place at the wrong moment. Until US interest rates stop rising (inflation is firmly defeated), equities will struggle.
And I’m done. Maybe I could have thrown in a bit about China’s growth being disappointing as well, but I think rates and inflation are really driving the bus.
But the thing is I do like writing the quarterly letter and communicating with investors, and I try to do a fun and informative letter this time of year, despite the rough quarter, so “ba da ba ba ba!” I’m going to talk about McDonald’s, or at least global burger economics, as the team is fully back out on the road again and almost everywhere we travel has cheaper burgers than the US (and cheaper stocks).
So the real letter starts with a higgledy-piggledy conversation with a couple of Japanese friends I had not seen since before Covid-19 on a research trip to Japan.
Japan was hot. You don’t want to go to Japan in August/early September, unless you are told it is your last chance to see companies before quiet period, so I went. I traveled with my partner firm, the Grandeur Peak team, and we saw around 70 companies in a week—I saw 35 as we ran two tracks of meetings.
I got up one morning early–before the heat was unbearable–to go for a long walk that led to an early breakfast for 2 at McDonald’s. We got 2 value meals (a sausage egg sandwich with hash browns and a drink and a fish sandwich with hash browns and a drink), which we translated into USD at that moment, and the entire meal was $7.19 USD—probably less than one meal in the US. I was stunned.
I mentioned this to my Japanese friends over dinner that night. “Wow, the US dollar is strong.” They retorted, “No, the Japanese yen is weak.” We were seeing different sides of the same coin, but the fact is after almost 30 years of deflation combined with a weak yen (and yes, likely driven by beggar thy neighbor policies in Japan today), Japan has some of the cheapest Filet-O-Fish sandwiches in the world; it feels like an emerging market now. It also has cheap stocks—even after the run this year in the markets, re-emphasizing the notion that many countries outside of the US are cheap on two counts—under-valued currencies and under-valued stocks.
For those of you who are not familiar, there is a real burger index in economics. The Big Mac index is a widely recognized and well-known index that compares the price of a Big Mac hamburger in different countries around the world with the standard Big Mac price in US dollars. The index was created by The Economist magazine in 1986 as a lighthearted way to measure the purchasing power parity (PPP) between countries, or in other words, whether a country’s currency is under- or over-valued based on the price of a sandwich relative to the US price.
The index has a handful of well-known flaws, such as not adjusting for the relative price of labor in each country and not being a diversified index (i.e. it is a measure of only Big Macs and not the McSpicy Paneer sandwich in India). The other flaw is that McDonald’s is not always there for you despite James Franco’s promise. It is not in many of the countries we have traveled as investors through the years; hence it does not give a full picture of the world. However, the index does provide a snapshot of global currencies and the global economy through a lens I think is valuable—just not complete.
I knew Japan was cheap before visiting, but breakfast at McDonald’s pounded this fact home for me. Sometimes it takes a tangible event like a cheap meal and trips to physically visit companies to understand the global economy.
This summer we traveled to the Philippines, Hong Kong, China, Indonesia, and Japan. These are all cheap places by Big Mac index standards and by our own due diligence with very good companies. The countries just lack a catalyst, which we continue to wait patiently and prudently for: please refer to the short quarterly paragraph above and the problem of rates and inflation in the US; it is easy to own US CDs at the moment. We need to see a peak in the US for those burger prices to flip (i.e. international and emerging markets stocks and currencies to attract investors again).
~ Laura Geritz
Rondure New World Strategy
New World underperformed the MSCI EM Index in Q3, declining -4.66% in the institutional share class (RNWIX) and -4.77% in the investor share class (RNWOX), both net of fees, while the benchmark was down -2.90%.
The primary culprits for the weak performance were several consumer stocks in China and Brazil that performed poorly. The strategy’s above-index-weight exposure to small-cap stocks, which fared worse than larger-cap stocks last quarter, also weighed down on performance.
In terms of sectors, the top relative contributors were Information Technology and Communication Services. The strategy’s significant underweight of Taiwan Semiconductor Manufacturing Co. and Tencent Holdings, both of which did especially poorly last quarter, aided relative performance. On the flip side, Consumer Staples and Consumer Discretionary holdings were the top performance detractors. The strategy is overweight both sectors, where we tend to find companies that fit our investment process well. In Q3, however, Consumer Staples did especially badly, which made our large exposure there costly. Consumer Discretionary fared better, but one of our larger weights in this sector, Chinese sportswear brand Li Ning Company, proved costly. Consumers in China are more beleaguered than we had expected after the country’s years-long experiment with Zero Covid. Their weakness has meant that consumer stocks like Li Ning that depend on the spending power of Mainland Chinese customers have struggled this year.
The mood on the ground from Chinese corporates is meek to bleak, as headlines in the US suggest. The silver-lining in China is stock valuations might already reflect managements’ pessimism. Valuations look good for high-quality businesses in China. Stimulus might be the catalyst needed to propel the most important economy in EM today. It is needed.
In terms of countries, the top relative contributors were South Korea and Vietnam. In South Korea, the fact that New World has little exposure was beneficial, as the country did much worse than the benchmark. Vietnam, in contrast, is not in the benchmark at all, yet we believe it is an emerging market that at times merits exposure. Our single holding there in Q3, IT outsourcing company FPT Corp., rose +23.17%.
RONDURE OVERSEAS STRATEGY
It was also a disappointing quarter for Overseas. Overseas returned -5.66% in the institutional share class (ROSIX) and -5.77% in the investor share class (ROSOX), both net of fees in Q3 2023, while its benchmark, MSCI ACWI ex-US Mid Cap, was down -2.10%.
Deep cyclicals (energy, which is a proxy for inflation) led the way this quarter, and large caps beat the smalls again. We are overweight with the small, but our biggest weight at present is cash, reflecting our caution as stock multiples re-rate down (remember P/E multiples are inverse to interest rates, or put simply, stocks are sold and go down as money moves to the juicy yields in US Treasuries).
Small caps have been a tough place to be since our inception, but especially now, as declining liquidity is more acute for stocks down cap (i.e. their value traded tends to be lower, exacerbating price movements when people buy and sell, which also creates bigger opportunities for active investors).
Below is an illustration of the drag on performance from our allocation to smaller companies for the year-to-date from Bloomberg’s data using our quarter-end portfolio against the MSCI ACWI Ex-USA Mid Cap Index.
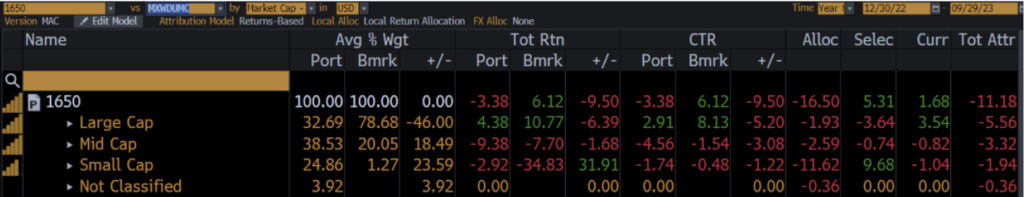
This year has been extreme in terms of the hit from allocation to smaller companies relative to our benchmark.
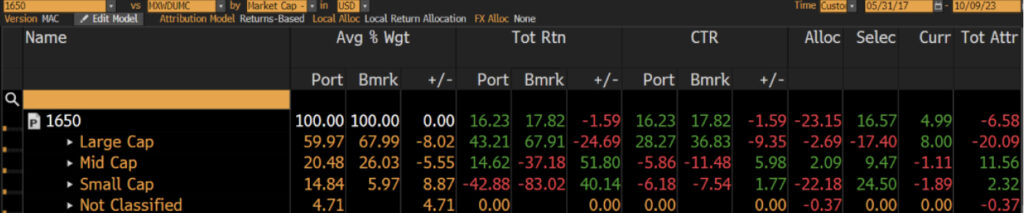
And the chart below is the same comparison, but going back to the month after the inception of overseas until the end of this quarter (I used 1 month after inception simply to allow time for initial cash to be deployed in stocks).
We believe we have been in one of the greatest large/mega cap and technology sector cycles we have seen since the start of our careers at the end of the technology bubble (aka the internet bubble), as a handful of mega-cap tech stocks are largely driving investor attention (though this time it is AI and not the internet).
You could even argue this cycle is more extreme than the 1999 internet bubble, as illustrated by the chart below from BofA Global Research
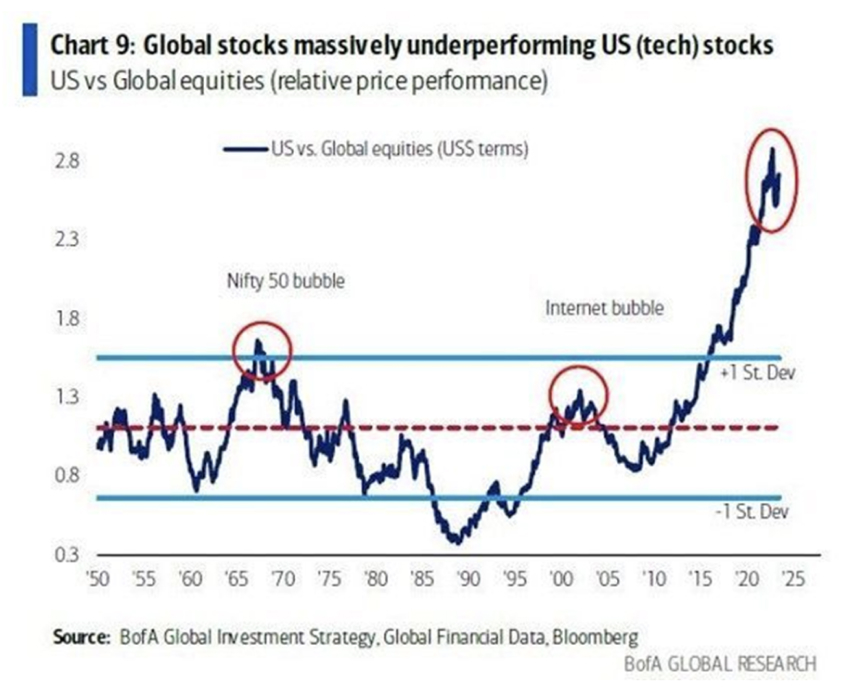
But we believe all of this means stocks are likely firmly cheaper outside of the US now.
Here is a rough look from Bloomberg at the metrics we use to think about the quality, value, and momentum/growth of our portfolio stacked up against US large cap stocks (as represented by the S&P 500 noted as Benchmark below).
| Overseas Fund (ROSOX) | S&P 500 | +/- | |
|---|---|---|---|
| Total Market Cap (mm) | 274,466 | 39,995,450 | -39,720,984 |
| Dividend Yield (%) | 2.4 | 2.0 | 0.4 |
| Price/Earnings | 17.4x | 21.5x | -4.1 |
| Price/Cash Flow | 10.9x | 15.1x | -4.2 |
| Price/Book | 2.4x | 4.1x | -1.7 |
| Debt/Equity | 58.10 | 124.15 | -66.05 |
| Current Ratio | 1.13 | 1.27 | -0.14 |
| Bloomberg Estimated Dividend Yield (%) | 2.9% | 1.7% | 1.2 |
| Return on Equity (%) | 13.7 | 17.00 | -3.3 |
We believe our portfolio has higher dividend yields, lower multiples, better balance sheets (which is often used as the biggest reason for punting small caps in a rising rate environment—refinancing risk), and a better estimated forward dividend yield. You could argue our quality is a bit lower if you look at ROE (return on equity), but that is because our portfolio in aggregate has more conservative financing—better balance sheets—again, illustrating that this portfolio likely has lower actual fundamental risk from rising rates than US large caps, as measured from the data on the S&P from Bloomberg above.
We don’t know when the tide will turn for the smaller companies in international and emerging markets (refer to interest rates and inflation peaking), but the case for valuation (the asset class as a diversifier against more expensive US stocks and currencies) is there.
OUTLOOK
In the “1975 Philosophy of Andy Warhol,” the artist wrote, “The most beautiful thing in Tokyo is McDonald’s. The most beautiful thing in Stockholm is McDonald’s. The most beautiful thing in Florence is McDonald’s. Peking and Moscow don’t have anything beautiful yet.”
In some respects, the world has changed a lot since 1975. In China, McDonald’s now has the first of its kind exercise bike tables, intended to power mobile devices as you peddle and eat, and China now has over 5000 stores.
In other respects, we worry global progress in the world is reversing through the lens of the burger. McDonald’s, which entered the USSR (Soviet Union) in 1990 (the year before the group of Soviet nations crumbled) to lines that numbered close to 40,000 people, closed its 800 stores last year in today’s Russia with the attack on the Ukraine.
We hope China doesn’t become Russia. We believe China needs to right its real estate sector and aggressively stimulate its economy, or it runs the risk of becoming Japan (more on that in a journal to come at a later date).
Japan, itself, became cheap after decades of economic stagnation when its economic “bubble” burst. We believe there are fundamental stock catalysts in Japan today that could help reverse some of this—fingers-crossed.
And, if you go almost anywhere outside of US borders today, currencies and hence burgers are cheap, as money is being sucked into juicy US treasury yields (as the Federal Reserve intended) from most asset classes and currencies around the world with only a very narrow set of equities, primarily in the US, doing well (probably not what the Fed intended as it shows fear of missing out, animal spirits, and the things that are exacerbating inflation are likely alive and well).
As mentioned last quarter, we believe the catalyst for international and emerging markets are peak inflation/interest rates and hence a peak dollar, and/or big bang stimulus from China. If so, stocks outside of US borders, are reasonably priced with a powerful potential dual kicker from currencies that also look undervalued (at least as judged through the lens of burger economics).
Thank you for your continued support for Rondure Global Advisors. We appreciate your partnership and trust!
~ The Rondure Team
TOP TEN HOLDINGS | As of September 30, 2023
Rondure New World Fund
| Company | % of Portfolio | COUNTRY | SECTOR |
|---|---|---|---|
| Yum China Holdings Inc. | 3.2% | China | Consumer Discretionary |
| Bangkok Bank PCL | 3.0% | Thailand | Financials |
| Hong Kong Exchange & Clearing Ltd. | 3.0% | Hong Kong | Financials |
| Bank Rakyat Indonesia Persero | 2.9% | Indonesia | Financials |
| GMexico Transportes SAB de CV | 2.7% | Mexico | Industrials |
| Coca Cola Femsa SAB de CV | 2.5% | Mexico | Consumer Staples |
| Sinbon Electronics, Co, Ltd. | 2.4% | Taiwan | Information Technology |
| Heineken Malaysia Bhd | 2.3% | Malaysia | Consumer Staples |
| Tata Consulting Services, Ltd | 2.3% | India | Information Technology |
| HDFC Bank Ltd. | 2.3% | India | Financials |
Holdings are subject to change and do not constitute a recommendation or solicitation to buy or sell a particular security.
Rondure Overseas Fund
| Company | % of Portfolio | COUNTRY | SECTOR |
|---|---|---|---|
| Kyushu Railway Co. | 2.6% | Japan | Industrials |
| GMexico Transportes SAB de CV | 2.5% | Mexico | Industrials |
| Puma SE | 2.3% | Germany | Consumer Discretionary |
| Heineken Malaysia Bhd | 2.3% | Malaysia | Consumer Staples |
| Parex Resources, Inc. | 2.2% | Canada | Energy |
| Alten SA | 2.0% | France | Industrials |
| OBIC Business Consultants | 2.0% | Japan | Information Technology |
| Bangkok Bank PCL | 2.0% | Thailand | Financials |
| GREGGS PLC | 2.0% | Britain | Consumer Staples |
| Recordati SpA | 1.9% | Italy | Health Care |
Holdings are subject to change and do not constitute a recommendation or solicitation to buy or sell a particular security.
FUND PERFORMANCE | As of September 30, 2023
Rondure New World Fund
| QTR | YTD | 1 Year* | 3 Year* | 5 Year* | Since Inception | |
|---|---|---|---|---|---|---|
| INSTITUTIONAL | -4.66% | -3.68% | 3.41% | -0.52% | 2.85% | 2.60% |
| INVESTOR | -4.77% | -3.78% | 3.17% | -0.77% | 2.59% | 2.35% |
| MSCI EMERGING MARKETS TR NET INDEX1 | -2.79% | 2.16% | 12.17% | -1.34% | 0.94% | 2.49% |
Rondure New World Fund
| QTR | YTD | 1 Year* | 3 Year* | 5 Year* | Since Inception | |
|---|---|---|---|---|---|---|
| INSTITUTIONAL | -5.66% | -4.69% | 4.67% | -4.04% | -0.43% | 1.95% |
| INVESTOR | -5.77% | -4.80% | 4.42% | -4.28% | -0.67% | 1.71% |
| MSCI ACWI EX US MID CAP TR INDEX2 | -2.10% | 7.59% | 21.35% | 3.10% | 1.91% | -2.10% |
Rondure New World Fund (RNWOX/RNWIX) – Inception date of 05/01/2017.
Expense ratios as of prospectus dated 10/30/2023 are:
RNWOX: 1.10% Gross, RNWIX: 1.31% Gross
Rondure Overseas Fund (ROSOX/ROSIX) – Inception date of 05/01/2017
Expense ratios as of prospectus dated 10/30/2023 are:
ROSOX: 0.85% Gross, ROSIX: 1.10% Gross
Data shows past performance, which is not indicative of future performance. Current performance may be lower or higher than the data quoted. To obtain the most recent performance data available, please visit www.rondureglobal.com. The Advisor may absorb certain Fund expenses, without which total return would have been lower. These expense agreements are in effect through October 20, 2024. Investment returns and principal value will fluctuate and shares, when redeemed, may be worth more or less than their original cost.
The Advisor has agreed to waive and/or reimburse fees or expenses of the Rondure New World Fund in order to limit Total Annual Fund Operating Expenses After Fee Waiver/Expense Reimbursement (excluding acquired fund fees and expenses, brokerage expenses, interest expense, taxes and extraordinary expenses) to 1.35% and 1.10% of the Fund’s average daily net assets for the Fund’s Investor Class Shares and Institutional Class Shares, respectively.
1The MSCI Emerging Markets Total Return USD Index is an unmanaged total return index, reported in U.S. Dollars, based on share prices and reinvested dividends of approximately 1,383 companies from 26 emerging market countries. You cannot invest directly in an index.
2The MSCI ACWI ex USA Mid Cap Index captures mid cap representation across 22 Developed Markets (DM) and 24 Emerging Markets (EM) countries*. With 1,200 constituents, the index covers approximately 15% of the free float-adjusted market capitalization in each country. You cannot invest directly in an index.
The limits for the Rondure Overseas Fund are 1.10% for the Investor Share Class and 0.85% for the Institutional Share Class, net of fees. This agreement (“the Expense Agreement”) shall continue at least through October 20, 2024. The Adviser will be permitted to recapture, on a class-by-class basis, expenses it has borne through the Expense Agreement to the extent that the Fund’s expenses in later periods fall below the annual rate set forth in the Expense Agreement or in previous letter agreements; provided, however, that such recapture payments do not cause the Fund’s expense ratio (after recapture) to exceed the lesser of 9i) the expense cap in effect at the time of the waiver and (ii) the expense cap in effect at the time of the recapture. Notwithstanding the foregoing, the Fund will not pay any such deferred fees and expenses more than three years after the date on which the fee and expenses were deferred. The Expense agreement may not be terminated or modified by the Adviser prior to October 20, 2024, except with approval of the Fund’s Board of Trustees.
An investor should consider investment objectives, risks, charges, and expenses carefully before investing. Visit www.rondureglobal.com to obtain a Rondure Funds Prospectus, which contain this and other information, or call 1.855.775.3337. Read the prospectus carefully before investing.
See the prospectus for additional information regarding Fund expenses. Rondure Funds will deduct a 2.00% redemption proceeds fee on Fund shares held 60 days or less. Performance data does not reflect the deduction of this redemption fee or taxes, which if reflected, would reduce the performance quoted. For more complete information including charges, risks and expenses, read the prospectus carefully.
The objective of all Rondure Funds is long-term growth of capital.
RISKS: Investing in foreign securities entails special risks, such as currency fluctuations and political uncertainties, which are described in more detail in the prospectus. Investments in emerging and frontier markets are subject to the same risks as other foreign securities and may be subject to greater risks than investments in foreign countries with more established economies and securities markets. Diversification does not eliminate the risk of experiencing investment losses.
Investments in lesser-known, small and medium capitalization companies may be more vulnerable than larger, more established organizations.
Northern Lights Distributors, LLC is the distributor of Rondure Funds.
Rondure Global Advisors is not affiliated with Northern Lights, Distributors, LLC.