After a Lost Decade, Emerging Market Equities Deserve a Fresh Look
Emerging markets are deeply out of fashion, yet the cycle may be turning. We believe it is time to consider adding to allocations.
Blake Clayton, PhD and Laura Geritz, CFA
WHITE PAPER
January 2023
EXECUTIVE SUMMARY
Emerging market equities have fallen deeper and deeper out of favor among allocators since 2011, with relative valuations nearing historic lows. We believe that the three factors that led to their underperformance are weakening and may be reversing. If we are correct, emerging market stocks may be in for a cycle of outperformance that has not been seen since the 2000s. Allocators should take a fresh look at upping their exposure.
Emerging Market Equities: What a Long Hard Decade It Has Been
Markets cycle. Investors know that to be true by experience. What outperforms in one season underperforms the next. Yet after a long up- or down-cycle, it is easy to forget that cycles do in fact have two sides. A new normal can make you forget the old normal.
Whenever the status quo seems permanent, it can presage a turning point in the market as the pendulum swings back in the other direction. Such is the case with emerging markets equities today, in our view.

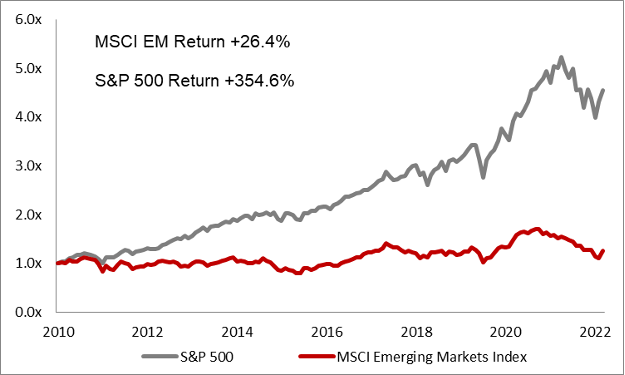
Emerging markets (E.M.) have done so poorly relative to U.S. equities since 2010 that their woeful returns seem like a fact of life (Figure 1). But that has not always been the case, and there is nothing written in stone that it will remain so. When we look at the drivers behind their disappointing performance versus developed markets over the last decade, we see the makings of a comeback, not of a broken asset class.
The 4 Relative Performance Cycles in Emerging Markets Since 1988
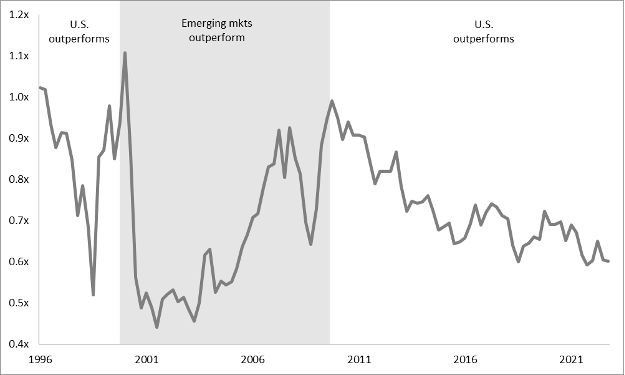
Over the last 35 years, emerging markets have cycled in and out of favor every decade or so. Figure 2 below charts the relative performance of the MSCI Emerging Markets, a leading benchmark, versus the S&P 500, going back to the beginnings of emerging markets as a sub-asset class in 1989.
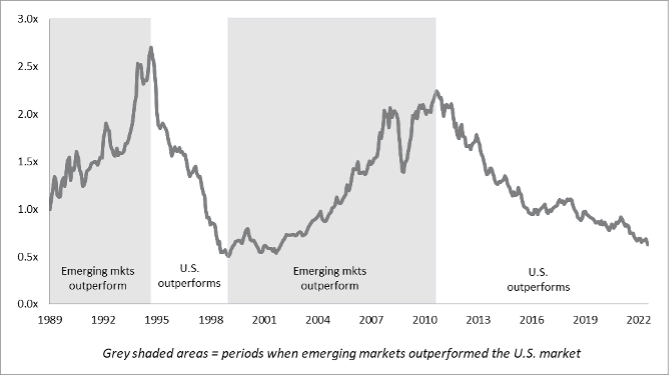
The last 12 years, in which emerging markets have lagged, is only the latest chapter. Relative performance is a cyclical phenomenon.
Reviewing the longer-term history is a reminder that today’s U.S. equity market dominance has not always been the case—nor is it destined to remain so, in our view.
1989-1994: Emerging Markets Outperform
When the Berlin Wall fell in 1989, it touched off the first modern bull market in the emerging market equities. Investors in Lower Manhattan and the City of London beat a path east, seeking to profit from the privatization of state enterprise and market liberalization in Iron Curtain economies.
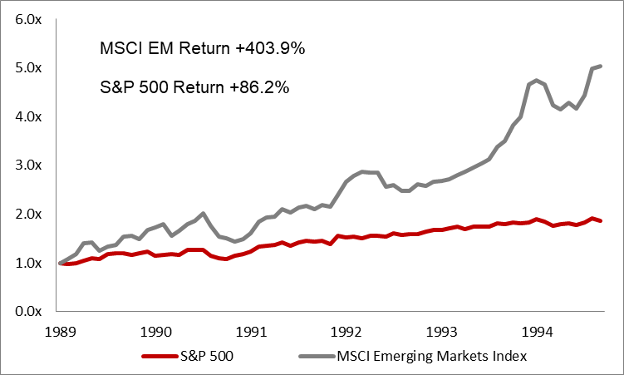
The Eastern Bloc opportunity, fueled by the prospect of a new era of “free markets and free people,” as the Wall Street Journal put it, sparked a bull market in emerging economies. Facing the economic doldrums of the George H.W. Bush administration, Western capital flowed into emerging markets, which handily outperformed the S&P 500 into 1994.
1994-1999: U.S. Market Outperforms
Capital flowed back to the United States in the mid-1990s thanks to the tech boom during the Clinton Administration. Beginning in 1994, the U.S. market regained leadership versus the developing world.
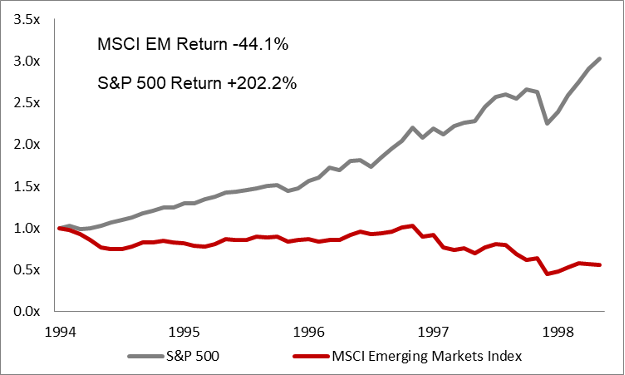
Investors were enthralled by NASDAQ-listed IPOs, particularly when two major crises emanated from emerging markets: the Mexican Tequila Crisis, sparked by the government’s devaluation of the Mexican Peso against the U.S. dollar in December 1994, and the 1997 Asian Financial Crisis, which also began as a currency crisis and unleashed massive capital flight out of the region.
1999-2010: Emerging Markets Outperform
The excesses of the dot-com bubble set the stage for emerging markets to outperform once again (Figure 5). Beleaguered after an epic collapse, the S&P 500 did not revisit its year 2000 high-water mark until 2007.
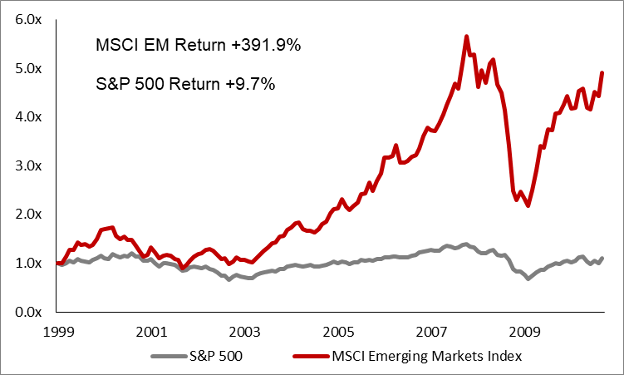
Meanwhile the triple combination of the once-in-a-generation rise of China as a major industrial power, a weakening U.S. dollar (as the Federal Reserve attempted to put a floor under the domestic economy), and rising commodity prices all powered a spectacular run for emerging markets. This was the BRIC era (Brazil, Russia, India, and China), hailed at the time as the ascendant economies of the 21st century.
2010-?: U.S. Market Outperforms
Shaking off the Great Recession, American equities have surged since 2009 on a wave of easy money from the Federal Reserve and stimulative fiscal policy from Congress. The U.S. dollar, whose demise was widely predicted after the crisis, strengthened after its 2008 lows. Emerging markets, in contrast, have floundered (Figure 6).
Emerging markets have faced a perfect storm: A rising dollar, a Chinese stock market that has failed to deliver, and comparatively anemic fiscal stimulus compared to their peers in the G-7 countries.
E.M. equities have not been this cheap on an EBITDA-multiple basis relative to the S&P 500 since the beginnings of the secular E.M. bull market in the 2000s (Figure 7).
Such a large valuation gap has always presaged change. We think that is true again this time.
Our case is that the three pillars of U.S. stock market dominance over the last decade appear to be weakening, paving the way for a resurgence in emerging markets. It is impossible to pinpoint the timing of an inflection point. But examining the three factors one by one shows why we think cracks may be appearing in the S&P 500’s long stretch of dominance.
3 Factors Behind Emerging Market Underperformance: Could Change Be at Hand?
Emerging markets have faced a perfect storm since 2010. The strengthening U.S. dollar is the chief culprit, although its strength is part symptom and part cause. Extraordinarily stimulative macroeconomic policy in the developed world and a lost decade in the Chinese stock market have also contributed. Yet there is reason to believe each of these factors may be waning.
Factor #1: A Strong US Dollar amid Disappointing E.M. Economic Growth
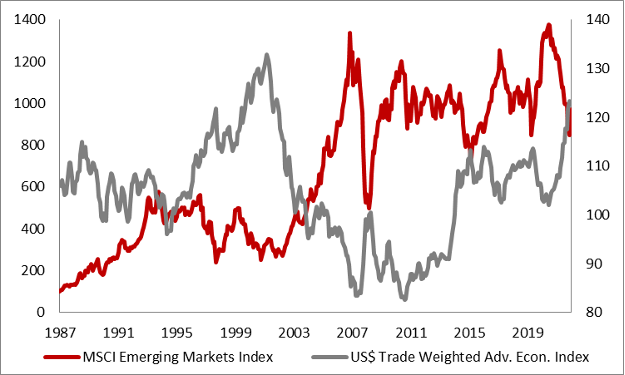
It is impossible to overstate how strongly E.M. equities are correlated to the U.S. dollar. Their beta to the dollar suggests a tight inverse correlation since 1989, as far back as modern data exists (Figure 8).

Figure 9 shows the data another way. During periods of U.S. dollar strength, emerging markets have declined. Inversely, when the U.S. dollar has weakened, E.M. stocks have thrived.
It is no coincidence that U.S. equities are outperforming as the greenback trades at highs not seen in a generation relative to other advanced-economy currencies.
Why such a strong link?
For one, monetary tightening by the Federal Reserve, which tends to support the dollar, tends to cause emerging market central banks to follow them to defend their own currencies, leading to economic contraction at home. Key E.M. markets are also import dependent, making a strong U.S. dollar inherently inflationary and requiring monetary and fiscal austerity. Moreover, the same macroeconomic circumstances that support a strong dollar, such as a flight to safety in global capital markets, drain capital from E.M. economies in a negative feedback loop that works against non-U.S.-dollar-denominated debtor nations.
Yet E.M. underperformance cannot all be hung on the dollar. Dollar strength is not purely exogenous: it was helped by two crucial shortcomings in E.M. countries. One was chronically disappointing growth versus the United States. China’s GDP growth has slowed from 12% to 4% since 2010. Korea’s has slowed from 8% to 3% over that period, to say nothing of Brazil, South Africa, and worst of all, Russia. The second failing relates to the lack of internal reform, which could have helped spur growth and close equity valuation gaps. India stands out as arguably the only major emerging market to improve its business, fiscal, and monetary policies since the Great Recession.
While currencies are unpredictable, we do not see a reason to believe that the U.S. dollar continues to strengthen from today’s generational highs. Three variables drive relative dollar strength: favorable growth differentials, interest rate differentials, and its safe-haven status. Its recent highs have been driven by the latter two, in our view. But we believe they will prove transitory, for two reasons. First, we do not believe that U.S. interest rates will continue to rise once domestic inflation begins cooling. Second, once today’s fears fade about a looming recession, runaway U.S. inflation, and the Russia-Ukraine situation, we think it is likely that capital markets come out of their defensive crouch and the dollar’s haven bid will lessen.
Factor #2: Aggressive Fiscal Stimulus in the Developed World
One of the reasons why developed economies have outgrown their developing peers is aggressive fiscal and monetary stimulus, in our view. Extraordinary stimulus has become a near-constant feature of economic policymaking in the United States, Europe, and other G-7 economies since the Great Recession. We do not see it as coincidental that equity markets in these countries’ have outperformed emerging markets in that timeframe.
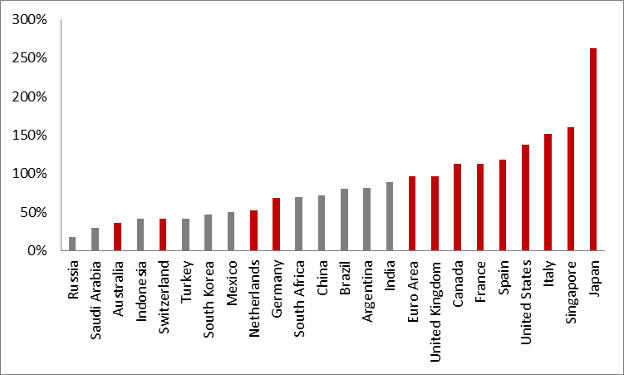
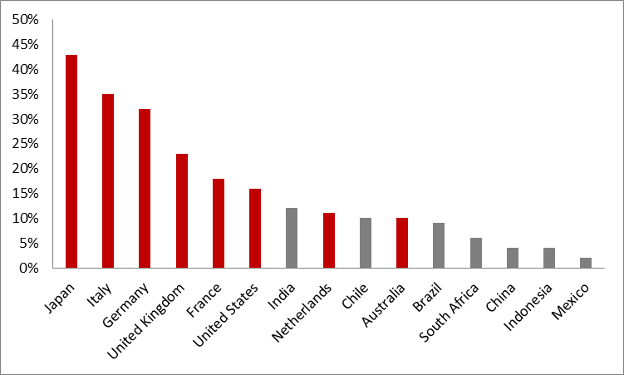
Figure 10 compares G-20 countries’ public debt relative to gross domestic product (GDP) as of the end of 2021. The red bars symbolize advanced economies while the grey bars represent emerging markets. Advanced economies accrued a once-unthinkable debt balance over the last decade, while emerging economies did not have the same prerogative, given the realities of their national balances.
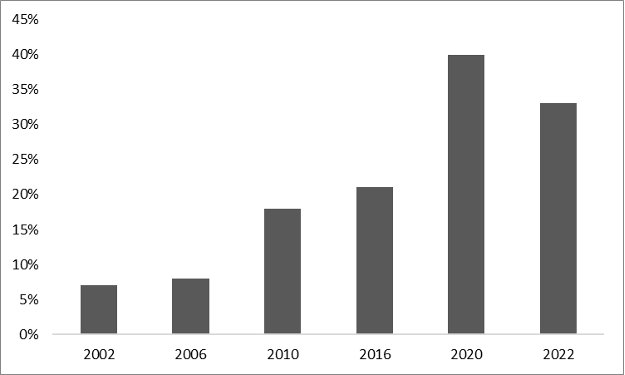
The disparity between stimulating countries and un-stimulating ones only widened during the Covid years. Figure 11 shows how much larger fiscal rescue packages were as a percentage of GDP in developed economies versus E.M. economies.
It is difficult to say whether public debt accrual in the G-7 will ever slow or reverse if it approaches unsustainable levels. That event has long been predicted but not happened. In the event that it does, it would help equity market valuations between developed and emerging market economies converge, in our view.
A new cycle of U.S. monetary easing would be especially constructive for emerging economies. Falling inflation in the United States should allow emerging economies more bandwidth to stimulate. The strengthening U.S. dollar of the last decade has had a tightening effect on emerging market monetary policy, as they struggled to contain imported inflation and defend their currencies. Were the dollar and Fed policymaking to go into reverse, the gap between the ever-stimulating developed nations and the never-stimulating developing nations may lessen, which would support E.M. equities on a relative basis.
Factor #3: How China’s Equity Market Performs
Ordinarily, no single country looms so large within a broad geographic index that its performance dominates the asset class. Yet as goes China, so go emerging markets, to a very real degree.
Chinese equities account for one-third of the MSCI Emerging Markets Index, the highest single-country concentration since South Korea’s 24% share in 2002. The Middle Kingdom’s dominance in the index has grown over time (Figure 12). It peaked at an astounding 42% in 2020.
Most of this growth is due to the rise in market capitalization of Hong Kong and U.S.-listed Chinese companies relative to other emerging markets, though MSCI’s decision in recent years to start including mainland Chinese-listed stocks, known as A-shares, also contributed. China has taken index share from countries like Mexico (peaked at 13% vs. 2% today), South Africa (peaked at 17% vs. 4% today), and Brazil (peaked at 16% vs. 5% today).
Chinese equity market returns drive major E.M. benchmarks to an extent that no single country ever has. It is simply too determinative. As Figure 13 illustrates, the correlation has become so strong (with 1 being a perfect lockstop correlation) that it is no exaggeration to say that nearly all the variability in emerging market returns are now driven by the Chinese stock market.
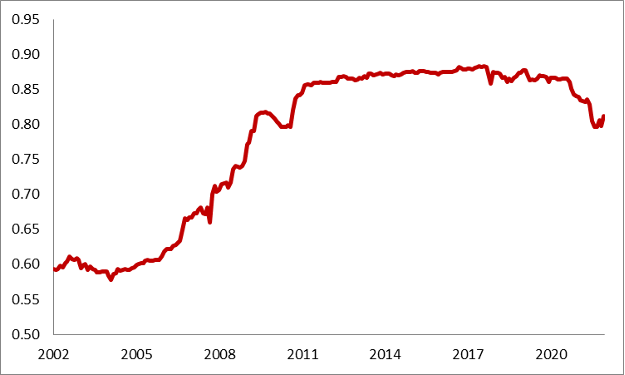
*Rolling 120-day correlation
The result of that concentration means that it is very unlikely that emerging markets as an asset class will ever come back into investors’ good graces without China doing well.
China has become to emerging markets what the American swimmer Michael Phelps was to the Summer Olympics in the United States. Theoretically it was always possible to get Americans to tune in to watch lap swimming if Phelps was not in the pool. But he was the selling point. To draw a parallel, while it is possible for E.M. equities to do well in spite of China, they are far more likely to succeed when China does. A secular bull market in China would do wonders for reviving the asset class, while a slump poses a major headwind to E.M. returns in aggregate.
We see a tailwind for Chinese equities going into 2023. It is the one major economy that remains partially locked down due to Covid. Reopening should improve corporate earnings momentum, which could catalyze stock prices, in our view. If Beijing can re-instill confidence in foreign investors that it is friendly to markets, it would be an additional tailwind to valuation multiples, which remain depressed relative to the rest of the world.
Conclusion
Emerging markets have underperformed their peers for more than a decade. Relative valuations hover near record lows. Neither situation is permanent. They are only the latest chapter in a cycle of market leadership that has oscillated between developed and emerging market equities for decades.
We think an E.M. rebound may be in the offing. Peaking inflation in the United States may be enough to pause a strengthening dollar or even see it decline, which historically leads to E.M. outperformance. Declining fiscal stimulus in the advanced economies and a rebound in Chinese equities would add two more catalysts.
We recommend allocators consider upping their exposure to this out-of-favor asset class.
About Blake Clayton, PhD
Dr. Blake Clayton serves as Rondure’s Co-Chief Investment Officer as well as a Portfolio Manager. Prior to joining Rondure, Dr. Clayton was a Vice President at Citigroup and a Fellow at the Council on Foreign Relations. He holds a doctorate from Oxford University as well as dual master’s degrees from the Cambridge University and the University of Chicago. Blake is the author of two books, Commodity Markets and the Global Economy and Market Madness: A Century of Oil Panics, Crises and Crashes. He teaches finance at the University of California at Irvine.
About Laura Geritz, CFA
Ms. Geritz is the CEO and Founder of Rondure Global Advisors, a woman-owned and led investment firm focused on high quality equity investing with a long-term view. Ms. Geritz is the lead Portfolio Manager for the Emerging Markets strategy and is the secondary analyst for one of the international strategies. Ms. Geritz has served as the Chief Investment Officer of the firm since inception and in 2020 was named Co-Chief Investment Officer. Ms. Geritz graduated with honors from the University of Kansas, earning a BA in Political Science and History. Later, she earned a Master’s degree in East Asian Languages and Culture from the University of Kansas.
About Rondure Global Advisors
Rondure Global Advisors is a boutique investment adviser dedicated to providing clients with high-quality international equities strategies. Founded in 2016 by Laura Geritz, CFA, it is a National Women Business Owners Corporation (NWBOC) certified majority women owned firm.
RON000462